Shareable Research

Share The Truth โ€” Download & Share

These infographics are free to share on social media. Right-click to save or tap and hold on mobile.

Last reviewed: June 3, 2026 โ€” Current status: current; graphics are shareable summaries and should be checked against linked source pages for the newest June 2026 details on DRIPA, land claims, FOI and health-care files.

๐Ÿ“Š The Numbers That Don't Add Up

BC spends hundreds of millions on a language spoken by 1 in 300 residents โฌ‡ Download & Share

๐Ÿ’ฐ Your Tax Dollars: Who Gets What?

Federal spend per on-reserve Indigenous person vs average BC resident โฌ‡ Download & Share

๐Ÿ—ฃ The Language Nobody Speaks

Punjabi speakers outnumber all Indigenous language speakers 43 to 1 โฌ‡ Download & Share

๐Ÿ— The $8 Billion Lie โ€” Site C

Site C cost doubled from $8.3 billion to $16+ billion under the NDP โฌ‡ Download & Share

๐Ÿ”„ The Conflict Nobody Talks About

Stewart Phillip UBCIC, married to NDP MLA Joan Phillip โ€” conflict of interest loop โฌ‡ Download & Share

โš–๏ธ Two Worlds, One Reserve

Chiefs earn up to $350,000 while band members earn $18,000 โ€” 16x gap โฌ‡ Download & Share
๐Ÿ“Œ About These Graphics

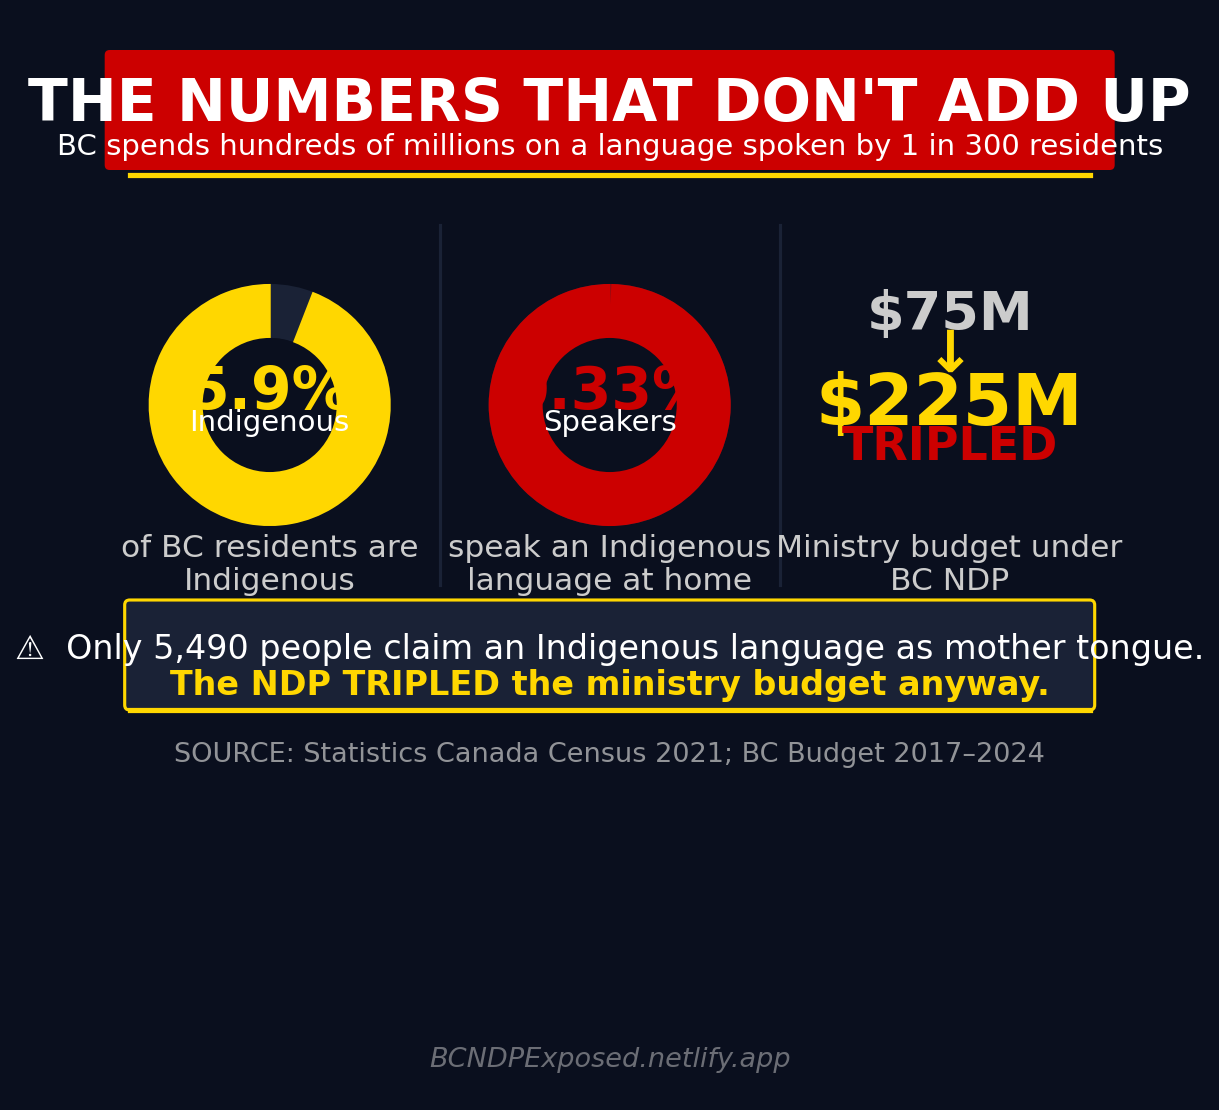
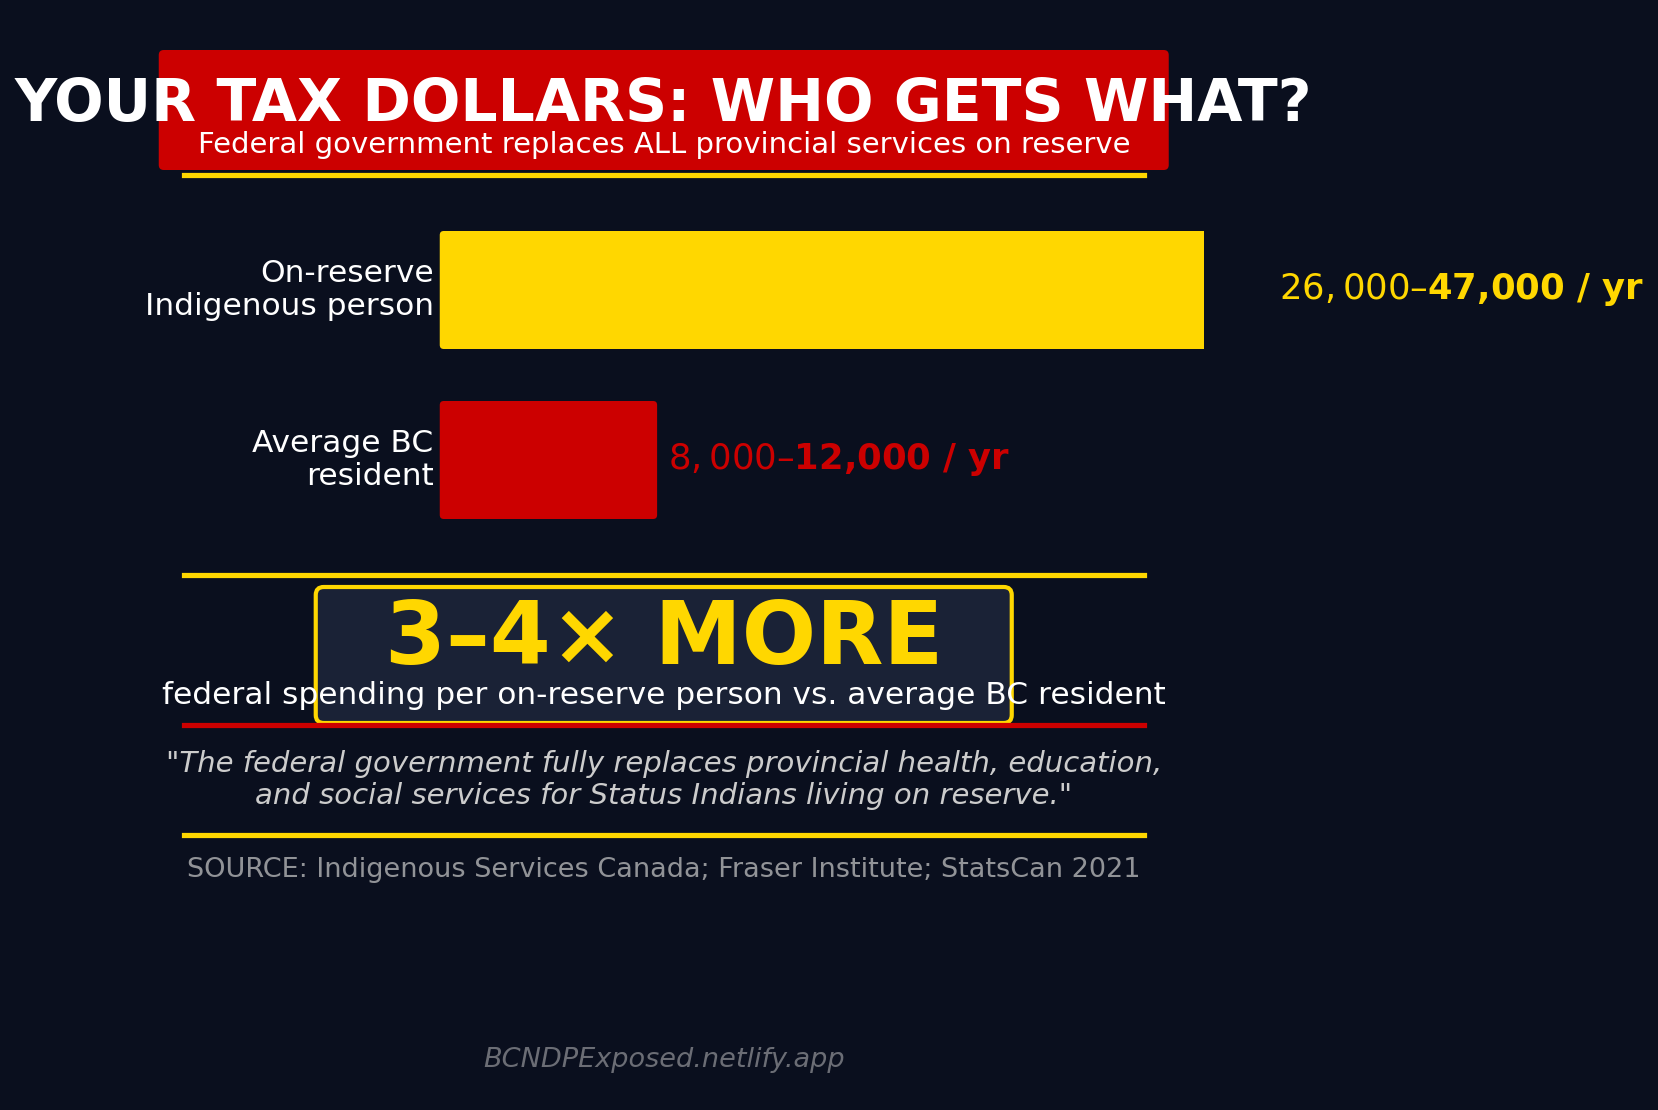
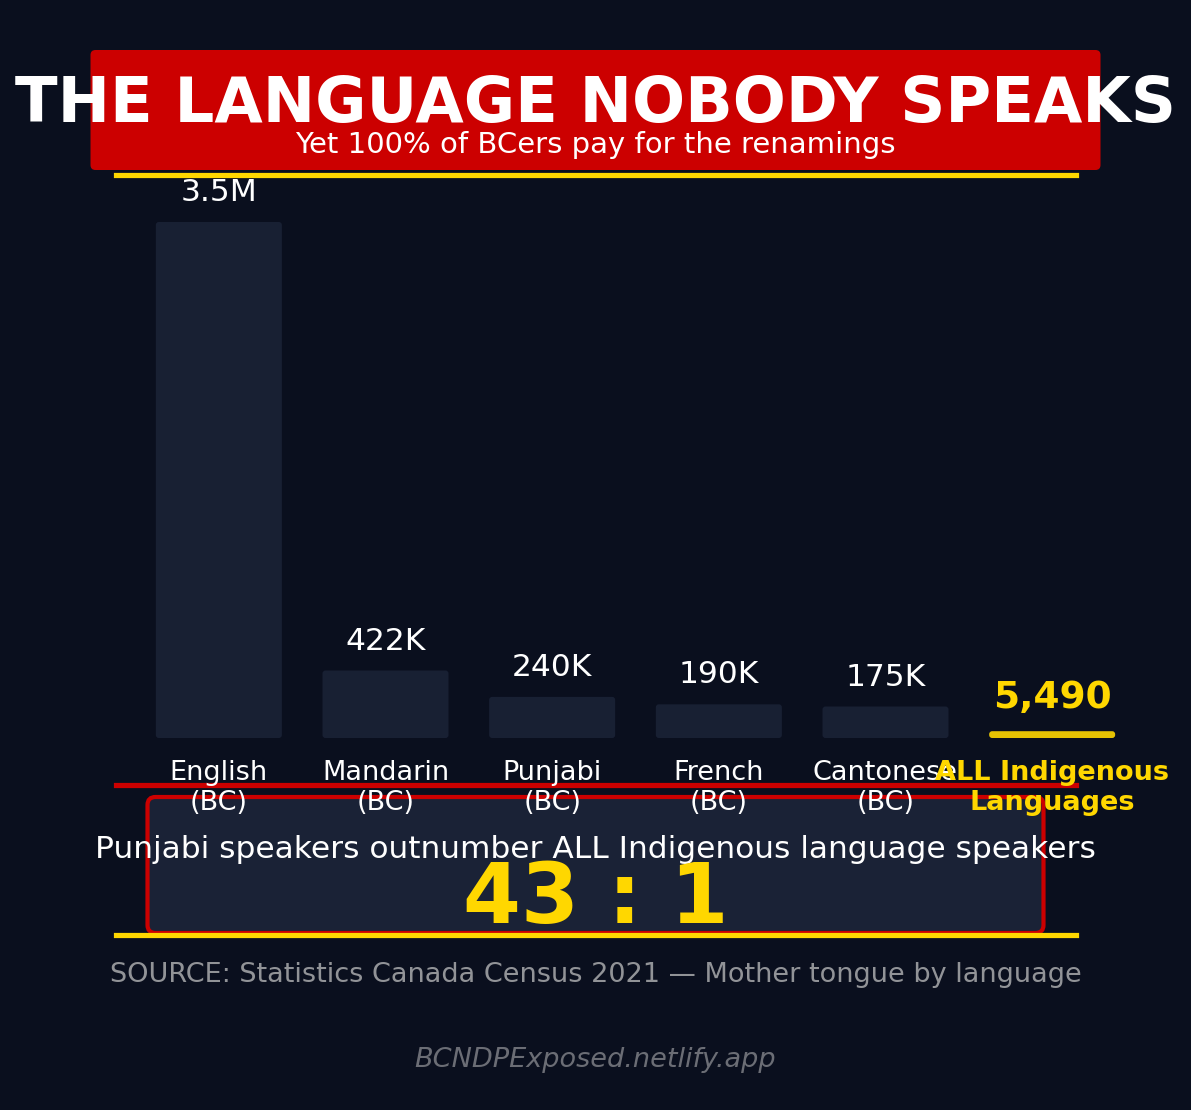
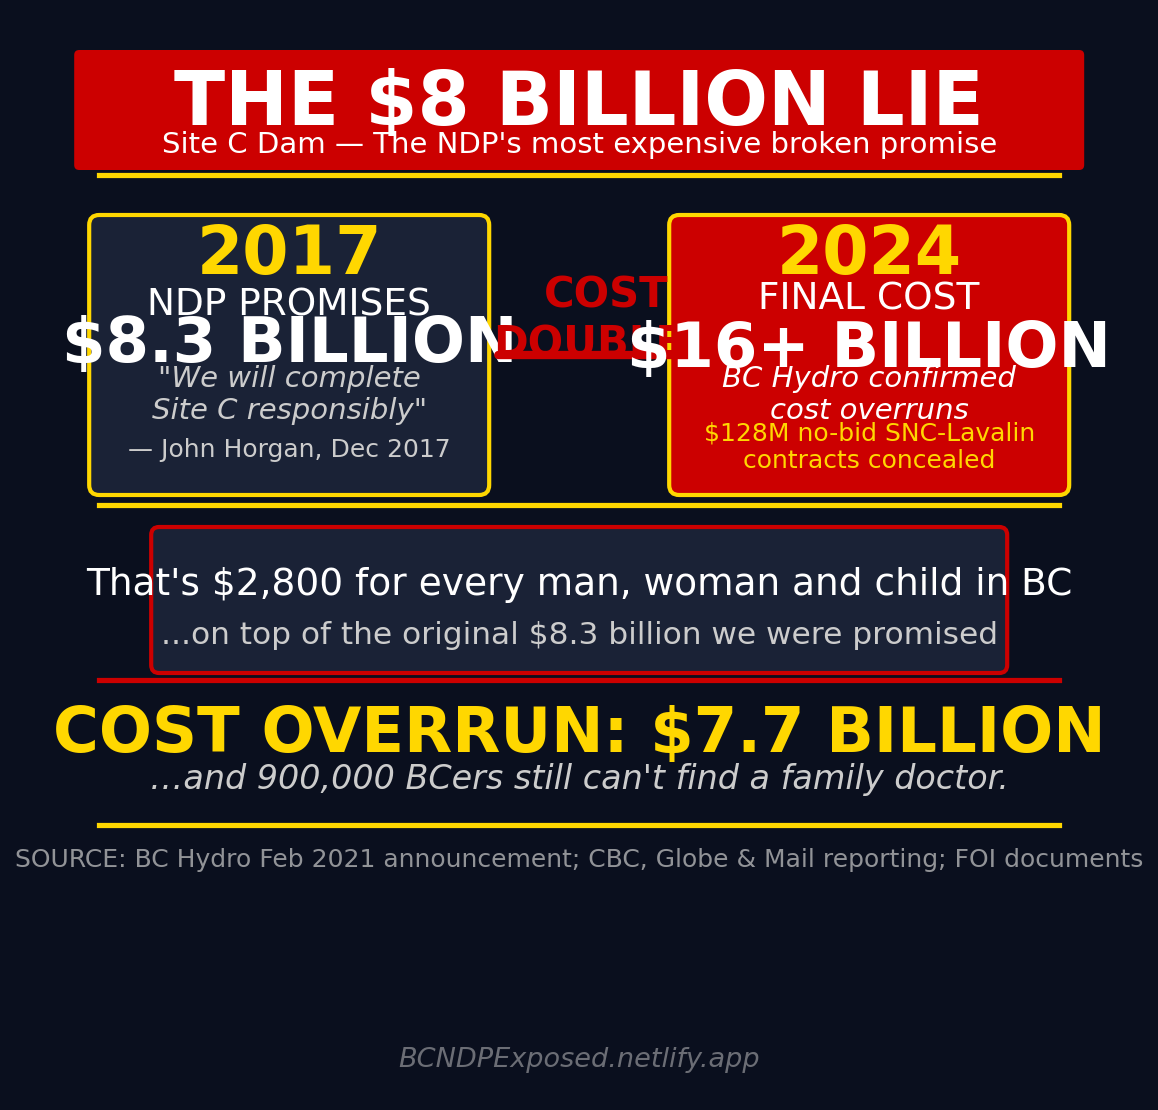
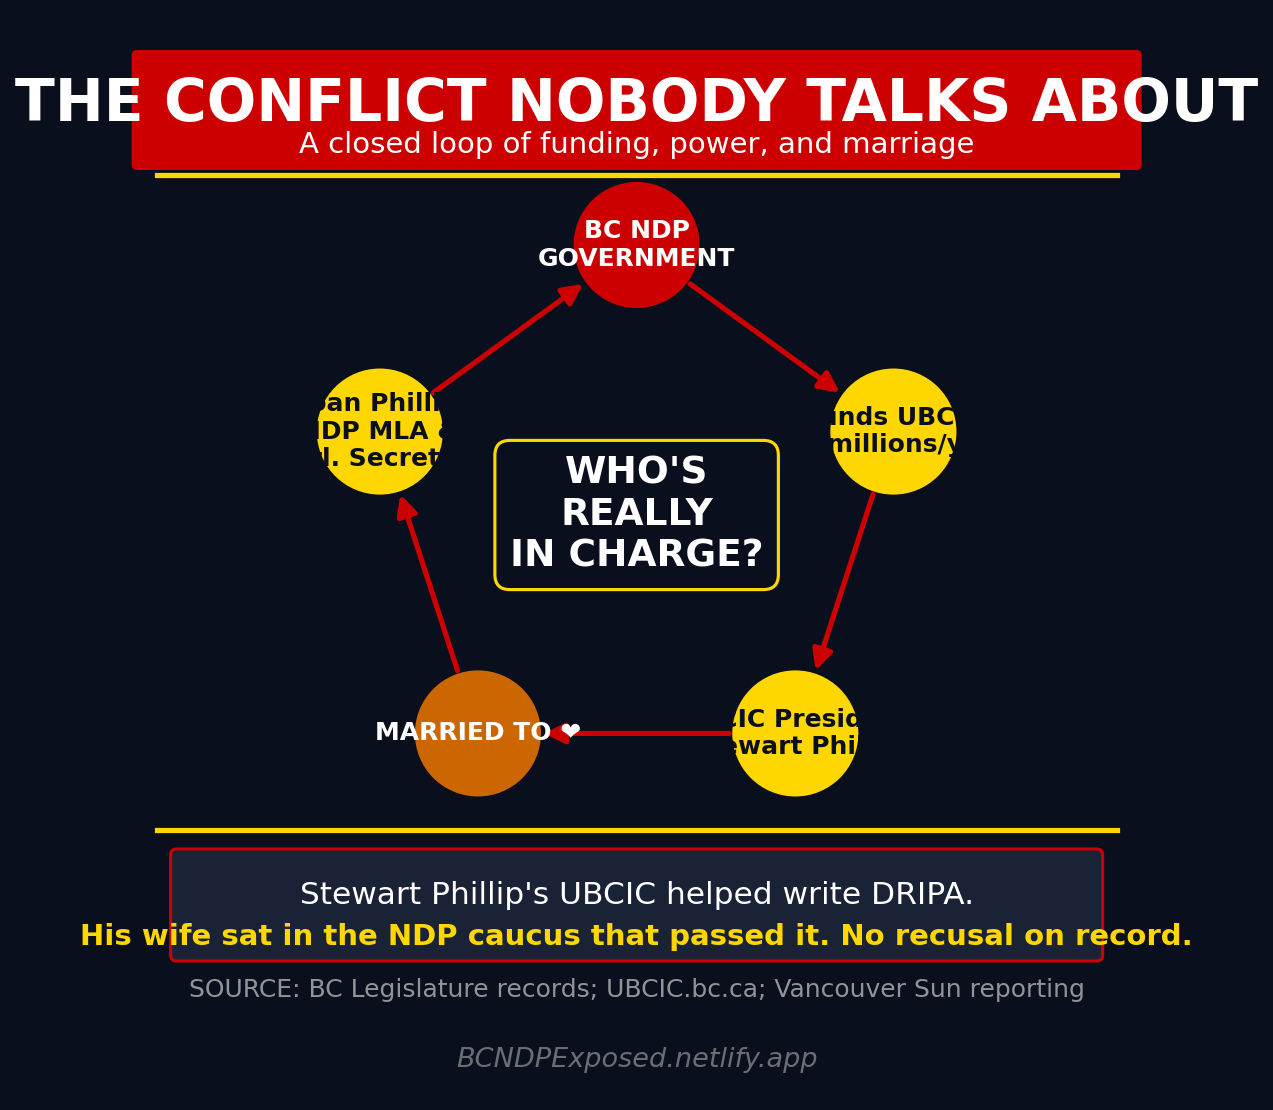
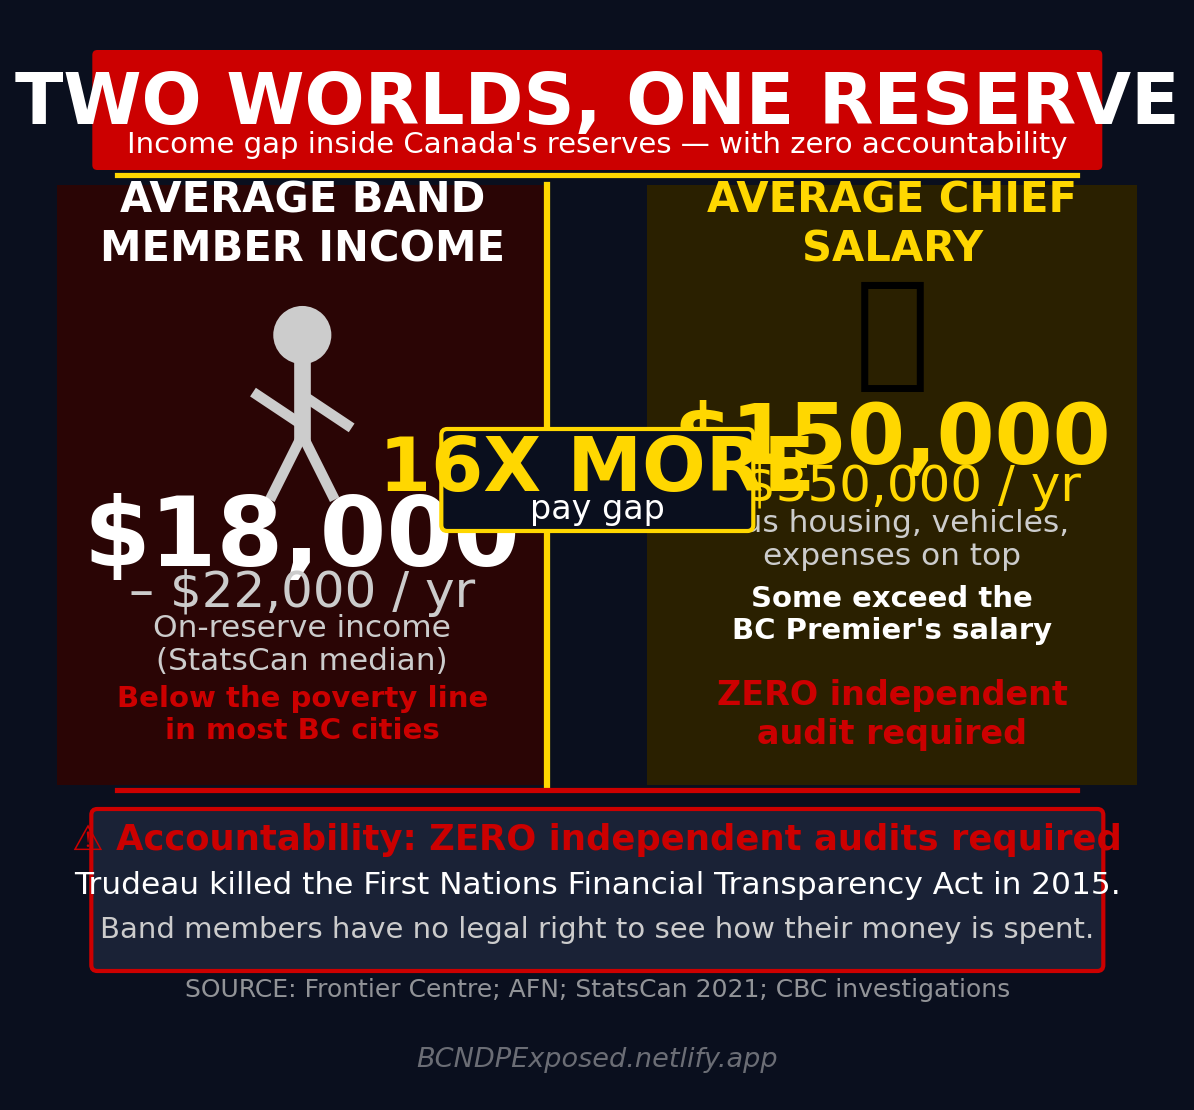
All statistics are drawn from public sources: Statistics Canada Census 2021, Indigenous Services Canada estimates, BC Hydro official announcements, BC Legislature records, and investigative journalism. These graphics are provided for political research and public interest purposes. Share freely โ€” no attribution required.